





Football pressure graph: how to read it
0:12 min · VideoThe pressure graph shows, minute by minute, which team is attacking and how hard. Learn to read bars, colours and shots, and to tell pressure from dominance.
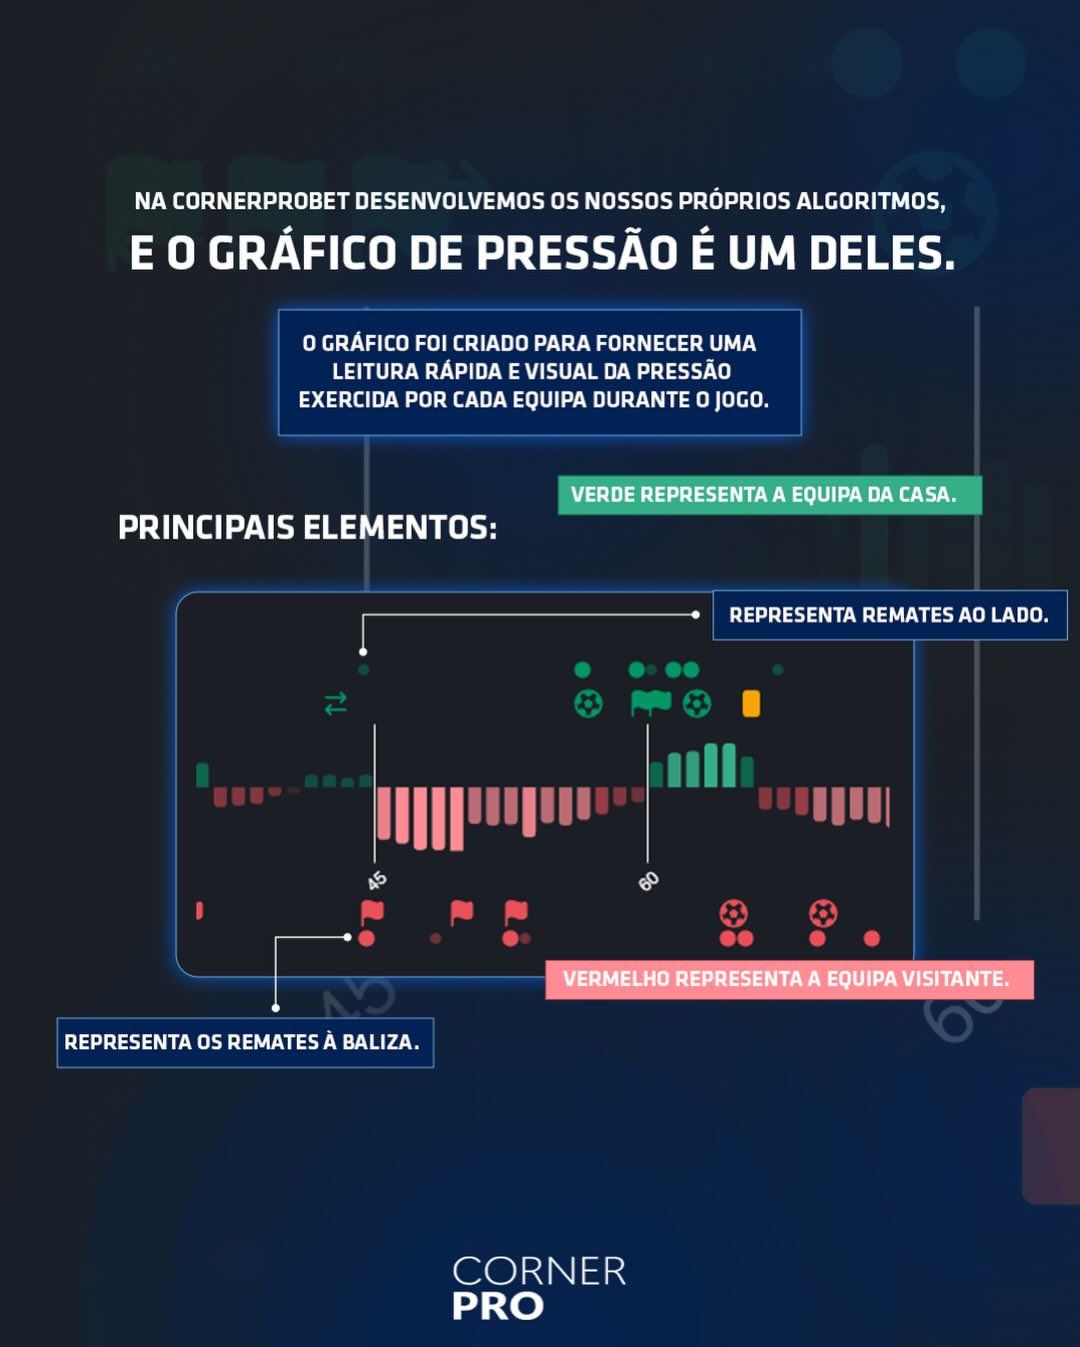
The pressure graph shows, minute by minute, which team is attacking and how hard. The size of the bar shows the intensity of the pressure, the colour shows the team (green for the home team, red for the away team) and the circles mark the shots.
Below you'll see how to read each element, the difference between Strong pressure and Clear dominance, and how the graph showed Switzerland's response against Argentina at the 2026 World Cup.
What is the pressure graph in football?
It is a visual reading of each team's attacking pressure over the course of the match. CornerPro built its own graph, calculated by its algorithms from the match data: attacks, dangerous attacks, shots and other events.
It helps you answer quickly a question the scoreboard can't: who is on top right now? A team can be winning and still have been pinned back for ten minutes. The scoreboard doesn't show that; the graph does.
How to read the bars and colours
- Colours: green is always the home team; red is always the away team.
- Bars: in each minute, the bar appears on the side of the team putting on more pressure. It shows on one side at a time, as a visual aid. To see both teams' bars, turn on Both pressure bars in ⚙ Customise cards.
- Bar size: this is what defines the intensity. Bigger bars, more attacking pressure; smaller bars, less.
The most important point: a bar being there does not, on its own, mean dominance. A team can have several bars in a row on its side, all small, and that only means it is slightly on top in a quiet match. If both teams have small bars, the match probably has little attacking activity at that moment.
What deserves attention is a run of big bars on the same side. That is where a team is pinning its opponent back in its own box.
Circles: shots on and off target
The circles mark the shots:
- Bigger circle: shot on target.
- Smaller circle, in another colour: shot off target.
In the Full scanner on the Live page, shots are dots: filled is a shot on target, outline only is a shot off target.
The reading comes from putting the two layers together. Big bars with no circles are pressure that hasn't turned into chances yet. Big bars with several big circles in a row are pressure that is already reaching the goalkeeper.
Strong pressure vs Clear dominance
Both are tabs in the Full scanner on the Live page, Strong pressure and Clear dominance, and they are not the same thing:
- Strong pressure flags a moment: a team has stepped up the intensity a lot over a specific period. It counts the last 15 minutes: a team with 7 minutes above 18 on the Pressure Index, or 5 above 20. While that is happening, the match card gets a pulsing orange frame (the Glowing frame on strong pressure option, on by default).
- Clear dominance flags sustained control: a team keeps an average Pressure Index at least 10 points above its opponent over the match.
In practice, Strong pressure answers "is it happening now?" and Clear dominance answers "who has been running the match?". A team can have Clear dominance and go ten minutes without a single Strong pressure moment, and the reverse happens too: a dominated team can have an isolated spike of pressure.
The High pressure filter in the Lite scanner is something else: it flags a team with high dominance and a high Pressure Index over the last 10 minutes.
Pressure Index (P) and the magnifier
Above the graph, each team has its Pressure Index (P): the cumulative attacking intensity (dangerous attacks, shots and possession in the final third). It is not a probability: it shows when each team was running the match, not who is going to win. Always compare the two numbers from the same match, and never with another match.
- Dominance: hover over the P and you see what share of the match's total pressure belongs to each team.
- The magnifier next to "Pressure graph" opens the Pressure Index minute by minute, with each team's value in each minute. Turn it on in ⚙ Customise cards → Magnifier for the chart numbers.
- Intensity peaks (IP): highlight on the graph the minutes in which a team was well above its own level in this match. They start at minute 15 and need an index of at least 13. Turn them on in Intensity peaks (IP) on the chart.
The P value changes with the Time Window chosen on the card (All, First Half, Last 15'…). The graph bars stay the same.
Real example: Argentina vs Switzerland (2026 World Cup)
In the quarter-finals of the 2026 World Cup, Argentina scored after 10 minutes and spent much of the match managing the lead. The pressure graph showed the moment that changed:
- Around the 60th minute, Switzerland's red bars got bigger and came in a row.
- Between the 64th and 68th minutes, Switzerland went from 2 to 5 shots on target: three big circles in a few minutes.
- Switzerland's Pressure Index reached 21.5 at 66 minutes and 28 at 68, against Argentina's 1.
- In the 67th minute, Switzerland equalised.
- At 70 minutes, Switzerland had 39 dangerous attacks, against Argentina's 11.
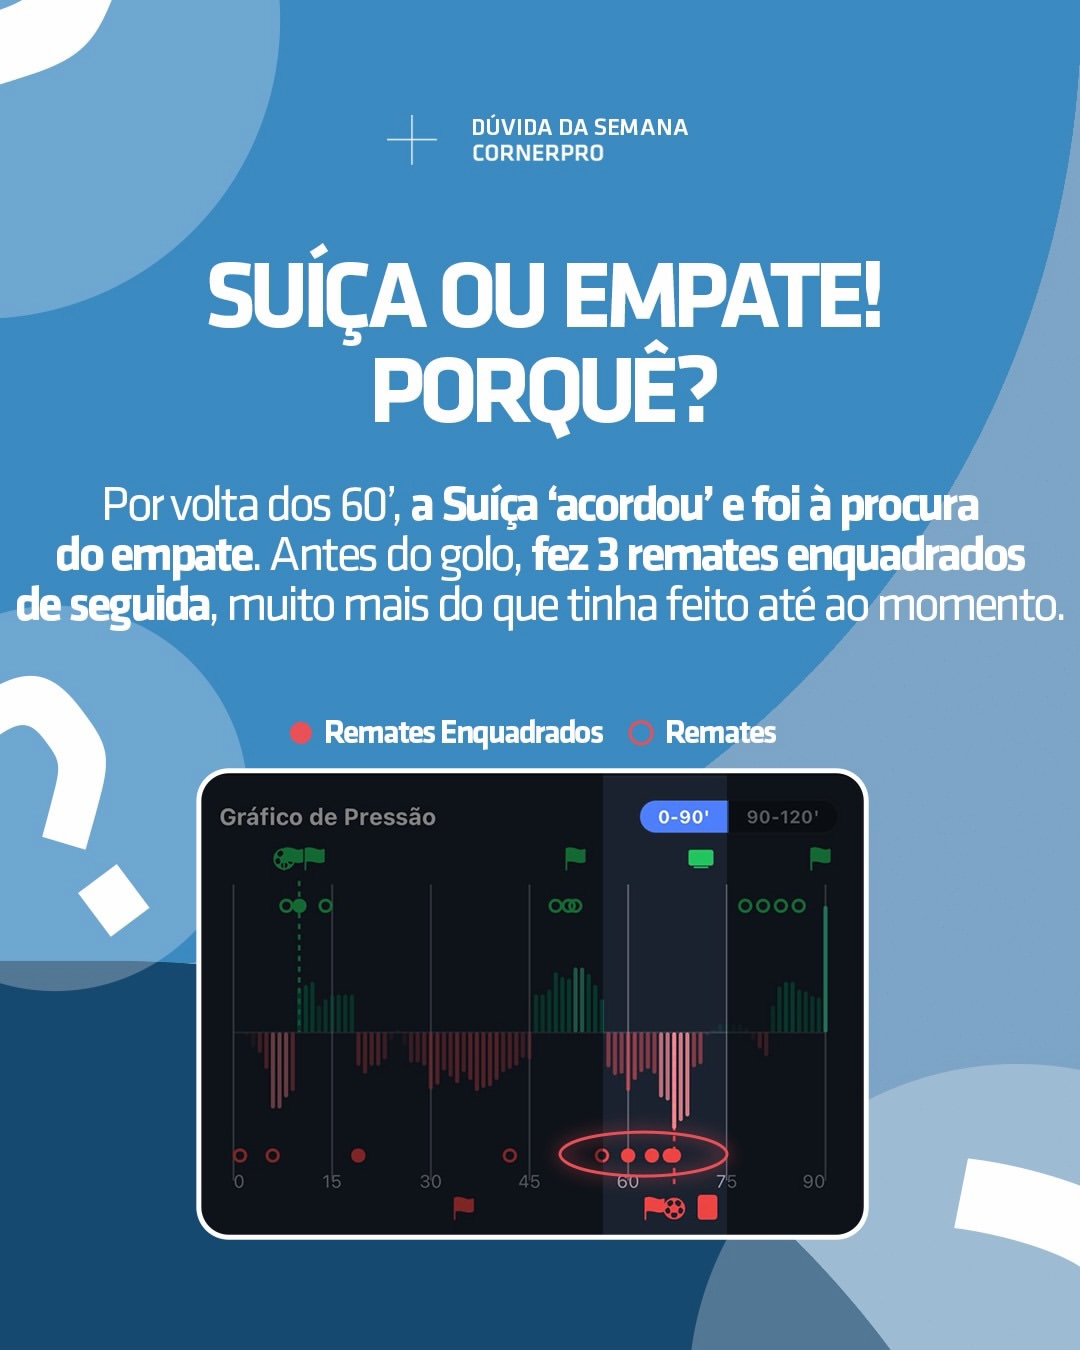
The rest of the match teaches something too. In the 72nd minute, Switzerland were reduced to ten men: Swiss pressure dropped straight after and, from the 82nd minute, the bars turned green, with Argentina pressing until the end of normal time. The match finished 1-1 after 90 minutes, and Argentina won 3-1 in extra time. The graph doesn't guess the result; it shows who is pressing at each moment, and an incident like a sending-off changes that reading straight away.
How to use the graph with L15 and the heat map
The pressure graph tells you who is pressing and how hard. Two tools complete the reading:
- L15: estimates the expected pressure for the next 15 minutes. If the graph shows pressure now and L15 is high, there is a sign that the spell may continue. In the match above, Switzerland's L15 was at 0.80 at 70 minutes.
- Heat map: tells you where the team is attacking from. Pressure down the flanks tends to produce crosses and corners; pressure through the middle tends to produce more shots.
None of the three decides on its own. The strongest signal is when all three point the same way.
Frequently asked questions
What does a big bar on the pressure graph mean? That in that minute a team put on a lot of attacking pressure. The size is the intensity.
Do several bars in a row on the same side mean the team is dominating? Only if they are big. Small bars in a row point to a match with little activity, with one team slightly on top.
What is the difference between Strong pressure and Clear dominance? Strong pressure is a moment of high intensity. Clear dominance is sustained control, with an average Pressure Index at least 10 points above the opponent.
Does the pressure graph predict goals? No. It shows where the pressure is. More pressure raises the chances of a shot, a corner and a goal, but guarantees none of them.
Where can I see the pressure graph? On the Live page (on each card in the Full scanner; in Lite, the PRESSURE 15′ column shows the last 15 minutes) and on each match's page. To look back at matches that have already finished, use the Time Machine.
Related tutorials
On the Pressure Chart, both teams have small bars. What does that indicate?
Answer to mark this tutorial as done.